It’s not something we posted much about anywhere, but it is out there in our notes, but did you know that there is a telemetry (signal data) output to json file in InvisaGig version 1.0.12 ?
If you try to load the main IP (or your tailscale IP) with the endpoint in the URL as follows: 192.168.225.1/telemetry/info.json
…
You will get an output of your InvisaGig’s connection info in an organized full data dump, like this (your browser may need a plugin to see the json in a formatted ‘pretty’ way) :
/ 20250212104444
// http://100.114.213.3/telemetry/info.json {this is my Tailscale IP}
{
“device”: {
“company”: “InvisaGig Technologies”,
“model”: “IG62”,
“modem”: “rm520”,
“igVersion”: “1.0.13”,
“fwVersion”: “RM520NGLAAR03A04M4G_01.204.01.204”,
“intStatus”: “online”,
“localIp”: “192.168.225.1”,
“ipptMac”: “20:7b:d2:91:20:4f”
},
“timeTemp”: {
“upTime”: “1:05 (HH:MM)”,
“timeDate”: “Wed Feb 12 16:44:41 UTC 2025”,
“temp”: “38c”
},
“activeSim”: {
“slot”: “1”,
“networkMode”: “LTE:NR5G”,
“conStatus”: “REGISTERED”,
“carrier”: “T-Mobile”,
“apn”: “fast.t-mobile.com”,
“ipType”: “IPV4V6”
},
“lteCell”: {
“lteCid”: 8104706,
“lteTid”: 31659,
“lteLac”: 44027,
“ltePci”: 409,
“lteFreq”: 66811,
“lteBand”: 66,
“lteUlbw”: “15 MHz”,
“lteDlbw”: “15 MHz”,
“lteStr”: -115,
“lteQal”: -13,
“lteRss”: -83,
“lteSnr”: 10,
“lteCqi”: 8
},
“nsaCell”: {
“nsaPci”: 253,
“nsaStr”: -100,
“nsaQal”: -10,
“nsaSnr”: 15,
“nsaFreq”: 501390,
“nsaBand”: 41,
“nsaDlbw”: “90 MHz”,
“nsaScs”: “30”
},
“saCell”: {
“saCid”: null,
“satid”: null,
“saLac”: null,
“saPci”: null,
“sacFreq”: null,
“saBand”: null,
“saDlbw”: “null”,
“saStr”: null,
“saQal”: null,
“saSnr”: null,
“saScs”: “null”
}
}
This snapshot of signal data is updated every minute, roughly, so you can poll this info at anytime and have a pretty up to date snapshot of your signal metrics. This is not stored beyond the latest output, so if you want a history, you simply poll the url and push the data into your own database or similar data keeping structure.
On my own playing arounds, I setup a PostgreSQL database on a machine connected as a Tailscale node on my tailnet, then also installed Grafana on the same machine, to visualize the data from the signal info, resulting so far in this:
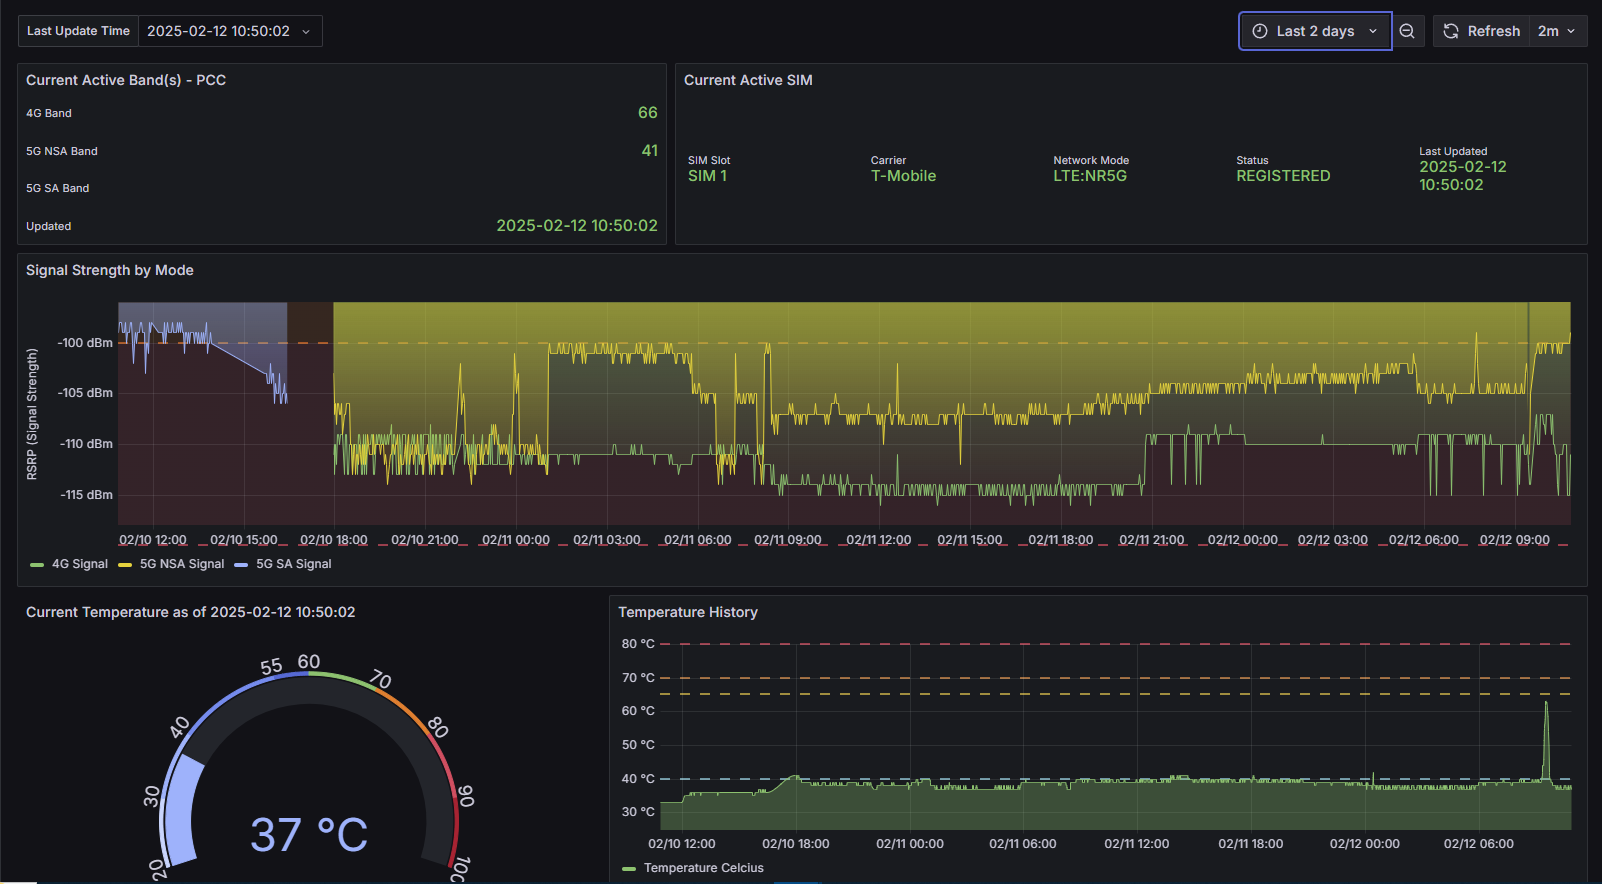
I am super new to this data visualization stuff, but it is pretty cool!
If you are super familiar with databases and data visualization, AND you have an InvisaGig, give it a go! Let us know what you come up with!
If you don’t know how to do this stuff, I am working on a tutorial!
…and if you don’t want to mess with figuring it out or following a tutorial, we may come up with something in the near-ish future. ![]()